
Big Data. You surely already heard about them…
Maybe in some TED talk that show how they are and they will change the world, or maybe at some business presentation that underlined the incredible value in the knowledge hidden in the sea of data we’re currently swimming in… But is harder to define when data are to be considered Big, and what it means to have Big Data or a Big Data problem.
A universal definition of what Big Data are is actually missing. While dealing with massive datasets is typically multidisciplinary, different communities have come out with different definitions, according to the perspective they have. Computer scientists, as myself for instance, usually define Big Data referring to the Five V’s:
- Volume –e the quantity, in GBs (or TBs, or even Zettabytes of data)
- Velocity –e the speed at which new data is generated and moves around
- Variety – the many different types of data one may encounter (numbers, images, texts, tables…)
- Veracity – the fact that these data need to be trustworthy
Statisticians, from their own perspective, may rather put their finger on the complexity of data, meaning that for them, data are big when they depend from each other in an increasingly complex way. A simple example con be found in stock prices, where the price of a given stock today is strongly related (we data scientists say “correlated”) with yesterday’s price, and maybe even to the one of the day before.
So from our perspective, after having revolutionized many fields of knowledge, Big Data are also starting to make a difference in helping politicians and scientists finding new solutions to tackle climate change.
The spreading of computer technology trough power grids are actually making them “smart”, meaning that IT helps both energy providers and consumers to manage better energy production and consumption. The understanding of those huge amounts of data can also be supported by online surveys and psychological questionnaires which can help in analysing the traits latent in our personality that guide us to be environmentally conscious citizens, or not.
The so-called smart devices used in power grids are for instance smart power meters, that are able to measure power consumption in real time, and send data via communication networks to be stored and analysed.
An interesting application of this technology is the use of real time feedback for power consumption to enable energy savings. Until today, energy users were mostly unaware of how much energy they were consuming, and when, mainly because gathering that information was cumbersome and difficult… without accounting for usual behavioural biases such as limited attention and present bias (i.e. recent information is seen to be more important that past one). Other common biases include overestimating the consumption of low-energy activities, such as LED lights or watching television, while underestimating the impact of high-energy activities, such as the use of a computer, of traditional or a microwave oven, or electric water heater. Moreover, people rarely know how much electricity does actually cost, and acquiring such information seeming difficult, consumers barely react to changes in electricity prices, that usually occur when the total demand of power is very high.
Thanks to the introduction of smart meters together with the development of technologies able to help storing the huge amount of data these meters generate, it is now possible to concretely help customers tackle some of these short comings and achieve real energy savings.
Also from the supply side, the real-time data consumption generated by these devices can also be used by energy production companies to vary the quantity of energy they provide during the day, thus being able to produce it in a cheaper and more ecological way.
As we inject more and more “smartness” into the energy network, more opportunities for consumption reduction unfold to our eyes. For instance, a smart appliance (such as an electric water heater, or a washing machine) can decide, if instructed by its owner, to turn itself on when energy costs drop due to a sudden increase in generated power, quite common with renewable energy sources that depend from meteorological phenomena.
From our perspective, as data scientists, the presence and availability of these kind of complex data also enables us to study how users behave when they consume electricity, and how they react when provided with additional information about their consumption.
In the last years many smart grid projects were developed in Europe. Take for instance the 3 year project focused on smart meters and consumers’ feedback which took place in central Italy in 2011. Among other initiatives undertook by the Italian energy utility responsible of this initiative in this particular area, a group of customers was given a kit studied to provide real time information about energy consumption. The device was provided for free during promotional events in schools, mass marketing campaigns and collaboration with public authorities and institutions.
The main component of this kit was a display installed in the house of the customer, that provided data about instantaneous consumption, as well as daily, weekly and monthly summaries. The display also provided information about the billing slot (in Italy, 3 billing slots are defined according to the time of the day) and about how much money was spent on energy, while some of these customers were also asked to fill a survey where they picked the electric appliances they owned from a list of 34. Analysing the data gathered during this experiment thanks to big data analytics and peculiar statistical methods, we were able to isolate from the load curves three groups of electric devices:
- A first group of basic appliances, such as TVs, ovens, fridges and washing machines,
- a second group of high tech devices, such as smartphones, tablets, digital cameras and gaming consoles,
- and a last group of appliances that use non sophisticated technology, and consume a lot of power like air conditioning systems, electric stoves, tumble dryers and electric water heaters.
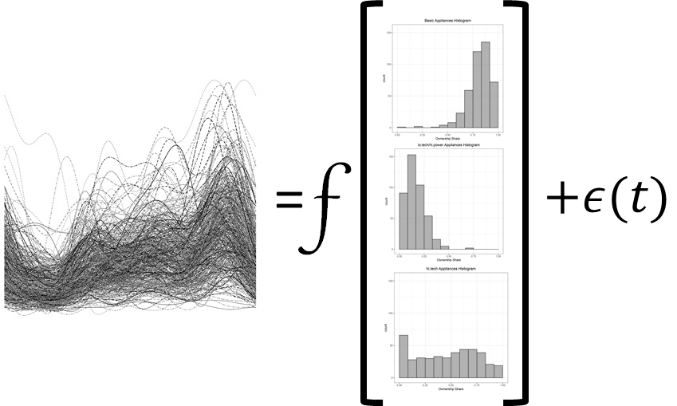
Analyzing more specifically these data about consumption, we were able to detail how consumption curves looks like, spotting valleys at night and plateaus during the day, minor peaks when people wake up, and when they come back home from work, and as expected a major peak in the consumption curve around 8 PM, when people enjoy their dinner and usually have their lights on.
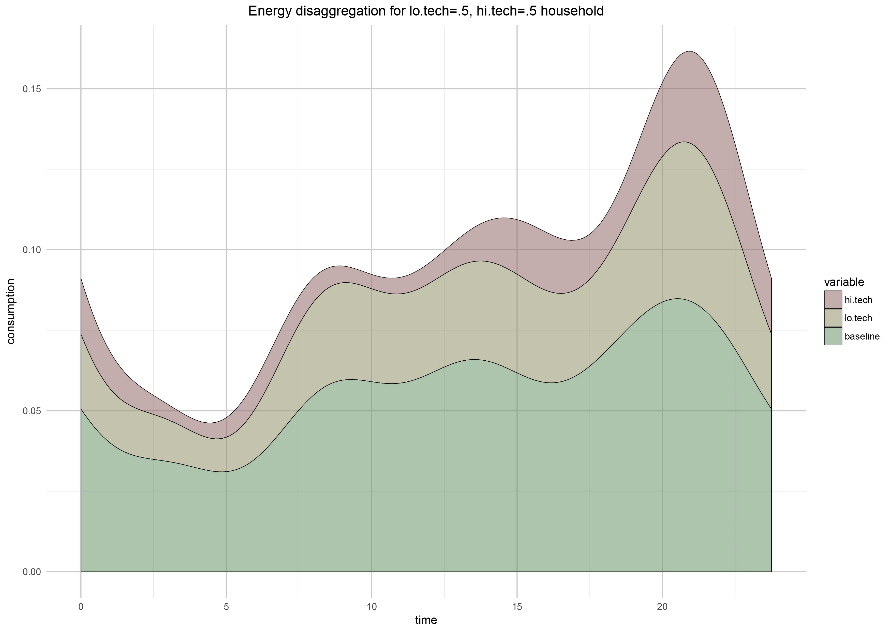
Using a set of statistical methods (called Functional Data Analysis) to model those curves, while combining the consumption profiles and the appliances clusters, we were able to identify “shapes” of consumption of appliances for each of these 3 groups.
Starting from a common baseline, (i.e. the consumption curve from which every customer starts), we pointed out that every power-consuming appliance had the effect of shifting the consumption curve as a whole upwards, while owning high tech devices has an effect on the peaks (both minor and major) and valleys of the curve.
We were also able to analyse how fast did customers change consumption during the day. For instance, for a customer owning many energy-intensive devices, the valley was steeper, meaning that probably they switch down these devices at night time all together. The high tech appliances on their side make the peaks steeper, meaning consumption increases more rapidly if a customer owns many of them. In this case, this is probably due to the fact that customers tend to switch on these devices all together.
Even if in this case we couldn’t spot a relevant impact of information on customers and their energy savings, smart devices and grids are starting to make a difference to lower energy consumption, as they give in a simple way the information customers are interested to and they allow supply companies to gather huge ammount of data which are potentially very useful to produce electricity in a greener way.
As we witness these rapid changes and new technologies changing the way we produce and consume energy, new smart devices now can allow clients to compare themselves to their peers living next to them thus unlocking a new set of possibilites to act on well known biases … but this is another story!